Music Analyzer
Spring 2022 API Final Project by:
Gerlise Chan, Kenneth Fargose, Srishankar Sundar, Arvindeva Wibisono
Abstract
Music and images are adjacent forms of art, each carrying and presenting information through a different medium. The transformation of one such medium into another and obtaining a new representation of the same information is thus an interesting prospect. One such example is that of synaesthesia, a rare condition where some individuals are able to visualize sound in certain forms of the condition. This phenomenon is used as inspiration for the project, where we implement a music analyzer that is able to detect the key and tempo and is able to transcribe individual notes in a given song, and this information is used to create a visualization that is based on the phenomenon of synaesthesia.
Introduction
The project aims to implement a music analyzer that is able to detect the key and tempo of a song, and extract the melody into a MIDI file. This information is then used to obtain a visualization of the song. The visualization is done by creating two ' maps ', i.e the color and pattern maps which are blended with each other to create the final image. The music analyzer is applicable to any song and the implementation of the same can be found on Github at https://github.com/arvindeva/API-final-project. According to simner2006synaesthesia, 2 to 4% of the population has synaesthesia and are able to either hear music from colors, or vice versa. This motivated the implementation of a music analyzer that is able to visualize music that could hold possible relevance to synesthetes, i.e those that experience this condition. This project combines feature extraction with automatic music transcription and it uses Machine learning to blend generated representations of information.
BPM and Key Detection
BPM and key are two of the most basic features in music. BPM means beat per minute, and it measures how fast a piece of music is by calculating how many beat occurs in a minute, BPM is the unit for tempo. On the other hand, key does not relate to tempo. In this context, key means the tonal note of a piece of music. For example, a song could be in the key of C Major.
To find the BPM, we used the built-in function from librosa librosa.beat.tempo(). Due to the fact that this feature is already in librosa, it shows that how fundamental it is to know the tempo of a song in BPM, and this is our most straightforward feature of the music analyzer because it was really simple to implement as librosa had already done all the heavylifting for us. On the other hand, the key detection part is a more complicated. The most implemented key detection method is the Krumhansl-Schmuckler key-finding algorithm as shown in [2], so that's the one we decided to implement. To implement this, we took an excerpt of code from github: https://github.com/jackmcarthur/musical-key-finder. The basic idea of the implementation is that we use librosa feature extraction, more specifically the librosa.feature.chroma_cqt() to get the constant-q chromagram of the song file.

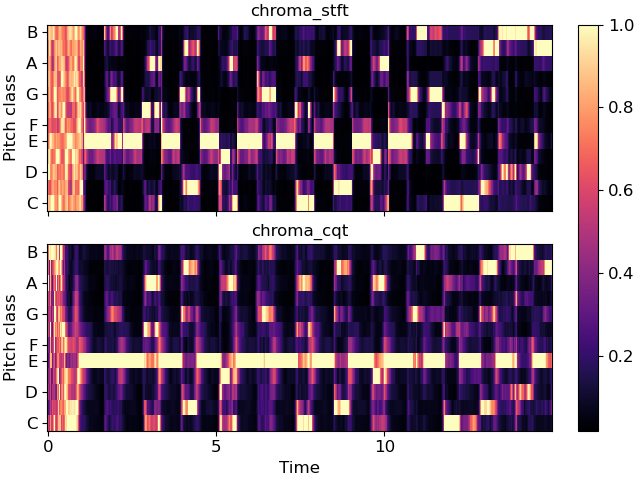
Figure: Chromagram
Once we have the chroma values, we build a dictionary to relate pitch names to the associated intensity in the song. With the intensity of each pitch known, we now can use the Krumhansl-Schmuckler key-finding algorithm which compares the chroma data to the typical profiles of major and minor keys and then find correlations between the amount of each pitch class in the time interval and the profiles, starting on each of the 12 pitches. We then create a dictionary of the musical keys, major or minor, to the correlation. Finally, we can print the top result which is the best estimate of what the music file is in the key of. If there's a key that's a close contender, we also print that key.

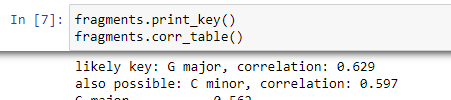
Figure: An example result of the key detection algorithm on the song 'Creep' by Radiohead, which in fact is in the key of G Major
Music Transcription
To extract the melody from a song, Omnizart is used which is a Python library that provides a solution to automatic music transcription (AMT). It is designed for ease of use and offers models which cover a wide class of instruments. The available modes for transcription are: music-piano, music-assemble, chord, drum, vocal and beat.
In our implementation, we ask the user for a YouTube link which is then downloaded in mp3 (for display) and wav format. In addition, we ask the user for one of the available transcription modes which are mentioned above. The default is set to music-assemble as this is overall able to extract the melody from a song. For different modes, different parts of Omnizart are used. For instance, when we chose the mode music-piano or music-assemble, we use Omnizart music and use the sub-command transcribe to extract and transcribe the melody to a midi file. To evaluate the performance of the transcription, the midi file can be synthesized using the package fluidsynth and wavfile from the scipy package.
Our implementation is a slightly modified version from the provided Google Colab notebook from the Omnizart website which can be found on https://music-and-culture-technology-lab.github.io/omnizart-doc/quick-start.html. Our code should also be run using Google Colab.
Transcription Results
Monophonic
Original (Piano):
Transcription:
Polyphonic
Original (Piano + vocal):
Transcription:
Original (Multi-instrument + vocal):
Transcription:
Visualization
Color Map
The Color Map is essentially a representation of the notes transcribed from the audio in the previous steps. Colors are associated with each note using a static mapping. We use the Scriabin Keys for this purpose.

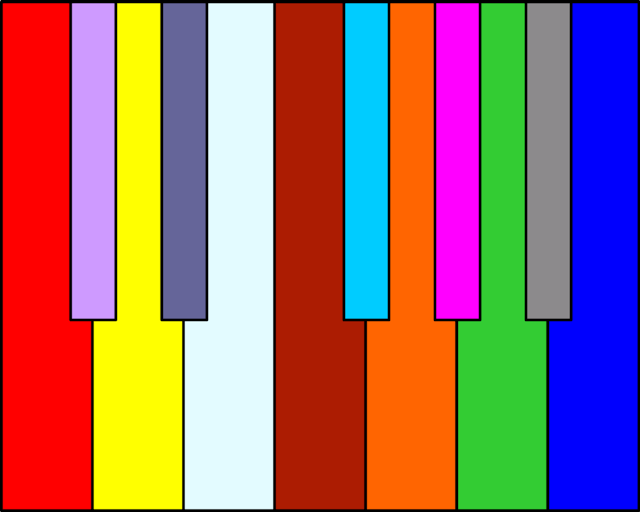
Figure: Scriabin keys
It is important to note that the Scriabin Keys are only one possible mapping in a domain that is not exact. There are possibly different mappings for different people who experience synaesthesia/chromesthesia. Thus the consistency of the mapping itself is not fundamental to the visualization, and the emphasis is rather on how the same is used. We could in the future try out different mappings to see how the same audio is visualized with different mappings. The Scriabin key dictionary is used for the visualizations showcased in the project as it displays good separation between adjacent notes while still maintaining a logic for notes, in that the colors are ordered by 5th-notes.
To construct the color mapping, we take the notes that have been transcribed using Omnizart, and the create an initial 'grid' from the same. The grid construction is done using OpenCV and Python. We show some of these grids below:
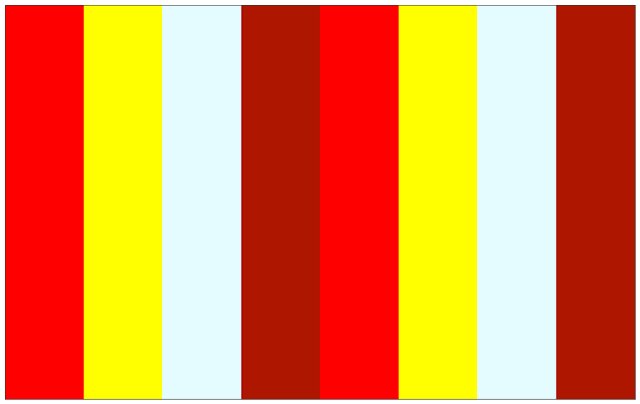
Figure: Color Map of 4 notes
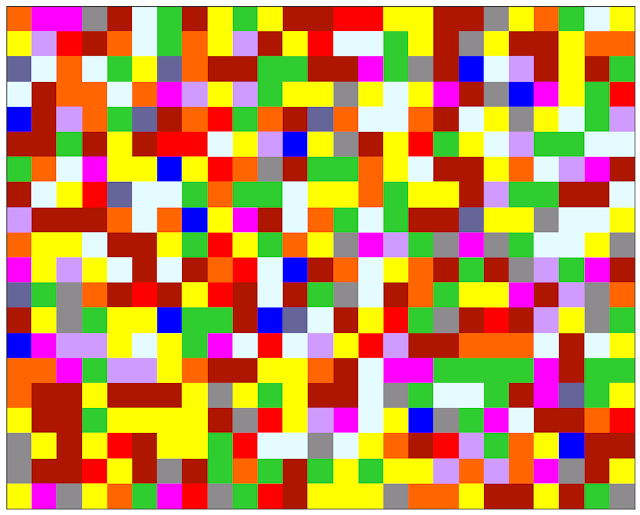
Figure: Color Map of a 4 Minute Song
Pattern Map
While color is an important aspect of visualization, we use a second layer, that of a pattern, in order to control further aspects of the visualization. The pattern map is constructed using the tempo information.
In order to generate the pattern map, we use the Compositional Pattern-Producing Network (CPPN) architecture implemented using PyTorch. Stanley et al. outline the idea behind CPPNs in [5] . The elemental difference in using the CPPN is that it does not output the entire image (like a Generative Adversarial Network would) but outputs individual pixels that are re-constituted. This aspect of its working allows us to control the patterns being generated.
We alter the architecture of the network on-the-fly based on the tempo (BPM) information. We control the number of layers and the number of neurons using the tempo. A higher number of layers and neurons result in more complex, noisy patterns. This is motivated by positing that faster songs yield more involved imagery, whereas slower songs would have simpler patterns.
A few example of the pattern maps generated are given below:
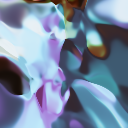
Figure: Pattern Map of a 120 BPM Song
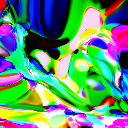
Figure: Pattern Map of a 160 BPM Song
Blending
The blending of the color and pattern maps are done using neural-style [6], which is a torch implementation using a Convolutional Neural Network of the concepts presented by Gatys et al. [7]. Neural-style is run through a containerized implementation found in the repository linked at https://github.com/ffedoroff/neural-style
Neural-style works by learning representations of two heterogeneous images - the style image and the content image. The style image is used to learn and consequently apply the aesthetic behind the intention onto the content image. Thus, we treat the color map as the content image and the pattern map as the style image. The colors used on the final image come from the content image, and thus only the pattern of the content image transfers onto the blended image.
The main preparation step before Blending is a modification of the color map. The grid-like aesthetic of the color map produces a visualization that is far too uniform on the final blended image. Therefore we subject the color map through specific passes using OpenCV to obtain a more 'artistic' rendition of the color map. An example of such a modified color map is shown below and the final blended images are shown and discussed in the results section.

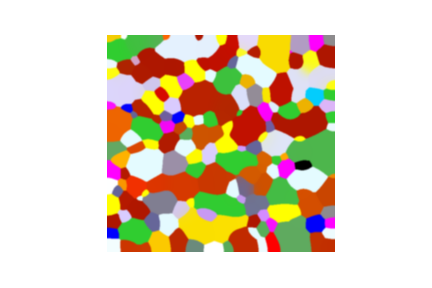
Figure: Modified Color Map
Visualization Results
We showcase two results, shown below:
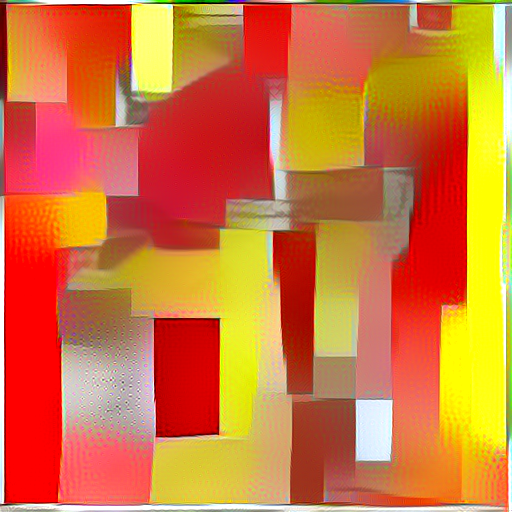
Figure: Visualization Result for a piece with only 4 Notes
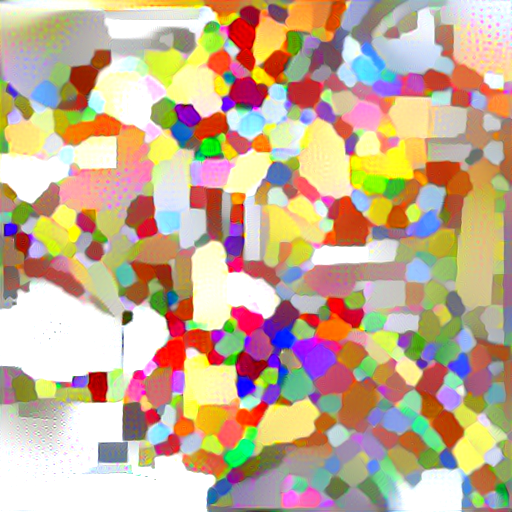
Figure:Visualization Result of a piece in D minor
We see certain patterns or 'links' appearing from the visualizations. Considering the visualization for the song set in D minor, we see predominant patches of white and yellow, which immediately correlate to high usage of the notes D and E, i.e the first two notes of the D minor scale. This correlates to the audio itself, where the melody predominantly repeats to these notes among a few others. There is also a moderate amount of note variety in the melody apart from the two notes, and this is reflected in the image, as apart from the patches of white and yellow, there are not many other larger patches. The patterns are moderately noisy as the song is set at a tempo of 98BPM.
We can compare this with the baseline image generated for the sample audio. This audio repeats 4 notes - C, D, E and F in that sequence repeatedly at a tempo of 60BPM. The colors for the notes are reflected well and with relatively less convolution due the pattern being less complex.
Nature of Results
The nature of results, and the task as a whole is based on crisp procedure but produces inexact results, which cannot be 'measured' as they would be in usual experiments.
Synaesthesia in itself is not a rule-based phenomenon to model off of. This is exemplified by the usage of the Scriabin Keys as the mapping used in the processes and results showcased. As stated in the \nameref(cmap) section, this is only one possible mapping, and the mappings themselves are not static across people who experience the condition. The Scriabin Keys are still relatively popular within mappings for synaesthesia due to its good spread of colors while maintaining a central logic.
The results could possibly be considered 'artistic' while still being based on a defined rule-set (color and pattern mapping). It is also important to note that the blending could get much better if the model is afforded a higher budget (while it is currently being run for 1000 iterations).
Limitations and Scope of Improvement
There is room for improvement in the following aspects of the visualization:
- Use of features: In the current implementation the notes transcribed from the song and the tempo are used to inform the visualizations. There could be further ways of implementing more features for the same purpose. This would result in more variety in the end result that would be further informed by the source audio.
- Blending: Blending is an expensive process, and was restricted in terms of the number of timesteps it was run for for the results shown. With increased number of iterations the style image is allowed to further influence the content image, thus the 'grid-like' nature of the content image is further reduced.
References
- Simner, J. et al. Synaesthesia: The prevalence of atypical cross-modal experiences. Perception 35, 1024–1033 (2006).
- Hart, R. Key-finding algorithm.http://rnhart.net/articles/key-finding/ (2012).
- Wu, Y.-T. et al. Omnizart: A general toolbox for automatic music transcription. arXiv preprint arXiv:2106.00497 (2021).
- Commons, W. File:Scriabin keyboard.svg — Wikimedia Commons, the free media repository2022. Link
- Stanley, K. O. Compositional pattern producing networks: A novel abstraction of development. Genetic Programming and Evolvable Machines (2007).
- Johnson, J. neural-style https://github.com/jcjohnson/neural-style. 2015.
- Gatys, L. A., Ecker, A. S. & Bethge, M. A Neural Algorithm of Artistic Style. CoRR abs/1508.06576. arXiv: 1508.06576. http://arxiv.org/abs/1508.06576 (2015).